
Never Miss a Crashing Pod Again

A lightweight Docker daemon that watches all your Kubernetes clusters and emails you the moment something stays broken for more than ten minutes.
If you run multiple Kubernetes clusters — an OpenShift lab, an RKE2 node, a K3s edge cluster — you know the experience: you ssh in two hours later to find a pod that has been crash-looping since before lunch, silently. No alert, no email, just a wall of CrashLoopBackOff in the event log and a service that's been down.
K8s Pod Monitor is the fix. It's a single Docker container that polls every cluster's API every 60 seconds, tracks how long each pod has been unhealthy, and fires a Gmail alert once anything has been broken for ten minutes. When the pod recovers, a follow-up email tells you it's back.
How it works
The daemon hits /api/v1/pods directly on each cluster's API server using a ServiceAccount bearer token. Failure state is kept in memory — nothing to persist, nothing to configure. A restart resets all the timers, which is fine: if a pod was failing before the restart it'll re-enter the failure window within a poll cycle or two.
The ten-minute threshold exists to avoid alert fatigue from transient blips: a pod that restarts cleanly after one OOMKilled is not worth a 3am email. One that's been stuck in ImagePullBackOff for fifteen minutes definitely is.
What counts as a failure
| Trigger | Detail |
|---|---|
| Pod phase | Failed, Unknown |
| Container waiting | CrashLoopBackOff, OOMKilled, ImagePullBackOff, ErrImagePull, CreateContainerConfigError, and others |
| Container terminated non-zero | Any exit code ≠ 0 |
| Init container failures | Same reasons, prefixed with Init: |
| Succeeded pods | Ignored — completed jobs are not errors |
The system namespaces (kube-system, kube-public, kube-node-lease) are skipped by default. You can add your own via SKIP_NAMESPACES.
Prerequisites
- Docker + Docker Compose on the host running the monitor
kubectlaccess to each cluster for the initial RBAC setup- A Gmail account with 2FA enabled (required for App Passwords)
- Network line-of-sight from the Docker host to each cluster's API server on port 6443
Setup in five steps
Step 1 — Create ServiceAccounts on each cluster
Apply the included rbac.yaml to every cluster. It creates a pod-monitor namespace and ServiceAccount, a pod-monitor-reader ClusterRole with read-only pod access, and a long-lived token Secret.
oc apply -f rbac.yaml                                      # OpenShift
kubectl apply -f rbac.yaml --kubeconfig ~/.kube/rke2.yaml  # RKE2
kubectl apply -f rbac.yaml                                 # K3s
RKE2 + Rancher quirk: If Rancher's webhook service is missing, namespace creation will be blocked. Patch the failing webhooks to Ignore first, then apply the manifest normally.Step 2 — Extract tokens
Run this on each cluster to get the decoded bearer token. The | base64 -d is not optional — the raw Secret data is base64-encoded, and pasting it without decoding will return a 401 on every poll.
# OpenShift
oc get secret pod-monitor-token -n pod-monitor \
  -o jsonpath='{.data.token}' | base64 -d

# RKE2
kubectl get secret pod-monitor-token -n pod-monitor \
  --kubeconfig ~/.kube/rke2.yaml \
  -o jsonpath='{.data.token}' | base64 -d

# K3s
kubectl get secret pod-monitor-token -n pod-monitor \
  -o jsonpath='{.data.token}' | base64 -d
Step 3 — Gmail App Password
Go to myaccount.google.com → Security → 2-Step Verification → App passwords, create a new password named something like "K8s Monitor", and copy the 16-character string. You won't see it again.
Step 4 — Configure docker-compose.yml
Paste your credentials and tokens into the compose file. All three lab clusters use self-signed API server certificates, so set INSECURE: "true" for each:
GMAIL_USER: "you@gmail.com"
GMAIL_APP_PASS: "abcd efgh ijkl mnop"
ALERT_TO: "you@gmail.com"

CLUSTER_1_NAME: "openshift"
CLUSTER_1_URL: "https://api.openshift2.lab.home:6443"
CLUSTER_1_TOKEN: "eyJhbGci..."
CLUSTER_1_INSECURE: "true"

CLUSTER_2_NAME: "rke2"
CLUSTER_2_URL: "https://192.168.1.99:6443"
CLUSTER_2_TOKEN: "eyJhbGci..."
CLUSTER_2_INSECURE: "true"

CLUSTER_3_NAME: "k3s"
CLUSTER_3_URL: "https://192.168.1.105:6443"
CLUSTER_3_TOKEN: "eyJhbGci..."
CLUSTER_3_INSECURE: "true"
If you have a CA bundle instead, supply the path and mount it as a read-only volume — no code changes needed:
CLUSTER_1_CA_CERT: "/certs/my-ca.crt"
volumes:
  - ~/certs/my-ca.crt:/certs/my-ca.crt:ro
Step 5 — Build and run
cd k8s-pod-monitor
docker compose up --build -d
docker compose logs -f
A healthy startup looks like:
[INFO] clusters: Registered cluster 1: openshift → https://api.openshift2.lab.home:6443 (insecure=True)
[INFO] clusters: Registered cluster 2: rke2 → https://192.168.1.99:6443 (insecure=True)
[INFO] clusters: Registered cluster 3: k3s → https://192.168.1.105:6443 (insecure=True)
[INFO] monitor: Starting pod monitor | clusters=3 | poll=60s | threshold=10min
Testing it
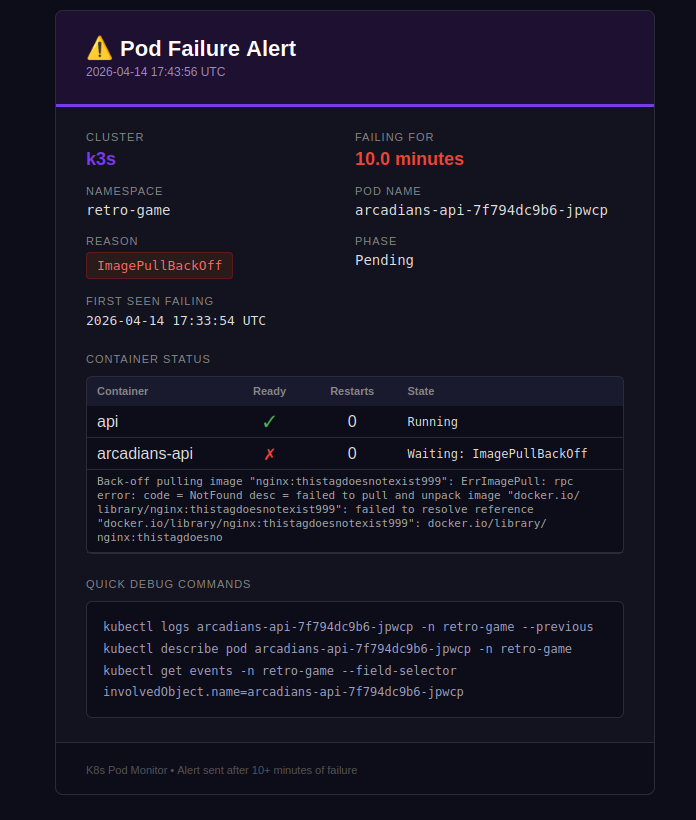
The easiest trigger is pointing a deployment at a tag that doesn't exist:
kubectl set image deployment/<name> -n <namespace> <container>=nginx:thistagdoesnotexist999
This produces ImagePullBackOff immediately. With LOG_LEVEL: "DEBUG" you'll see the failure timer counting up each poll:
[DEBUG] monitor: [k3s] retro-game/arcadians-api-xxx failing (ImagePullBackOff) for 1.0 min — alert_sent=False
[DEBUG] monitor: [k3s] retro-game/arcadians-api-xxx failing (ImagePullBackOff) for 2.0 min — alert_sent=False
...
[INFO]  monitor: ALERT: [k3s] retro-game/arcadians-api-xxx (ImagePullBackOff) failing for 10.0 min
After ten minutes you get the alert email, and when you roll back with kubectl rollout undo the recovery email follows.
kubectl rollout undo deployment/<name> -n <namespace>
Tuning
| Variable | Default | Description |
|---|---|---|
POLL_INTERVAL_SECONDS |
60 |
How often to query all clusters |
ALERT_THRESHOLD_MINUTES |
10 |
Minutes before an alert fires |
SKIP_NAMESPACES |
— | Comma-separated extra namespaces to ignore |
LOG_LEVEL |
INFO |
Set DEBUG for per-pod poll output |
Adding a cluster
Add a new numbered block to docker-compose.yml — no code changes, no rebuild needed:
CLUSTER_4_NAME: "my-cluster"
CLUSTER_4_URL: "https://192.168.1.x:6443"
CLUSTER_4_TOKEN: "eyJhbGci..."
CLUSTER_4_INSECURE: "true"
Networking note
The container runs with network_mode: host so it can reach LAN addresses and internal DNS names like api.openshift2.lab.home without any extra routing config. The monitor only makes outbound HTTPS calls to port 6443 — nothing is exposed inbound.
State is in-memory only. A container restart resets all failure timers — but any pod that was already broken will re-enter the alert window within a poll cycle or two, so in practice this is rarely an issue.